Inspecting Work
Android Studio Arctic Fox expanded the App Inspection tool beyond the original Database Inspector for Room. It now contains a “Background Task Inspector” that lets you know what WorkManager work has been scheduled or has completed, along with the details of that work.
In addition to requiring Arctic Fox (or newer), this tool also requires that your app use 2.5.0 or higher of the WorkManager dependencies.
Starting the Inspector
As with the Database Inspector, you get to the Background Task Inspector via the “App Inspection” tool window. If this is not already docked on the edges of your IDE window, you can open it from View > Tool Windows > App Inspection from the main menu.
You also need your app that is using WorkManager to be running in order to get to the Background Task Inspector tab. You can run the app first, then open the App Inspection tool window, or open the tool window first and then run the app. If your process is not selected automatically, a menu in the tool window will let you choose it.
Examining the Results
The Background Task Inspector tool window has several sub-views that give you details of the pending, in-progress, and completed pieces of work.
Note that WorkManager stores its work information in a Room database, and so the details of completed pieces of work persist past process termination. It is not quite clear when those entries get pruned from the database.
The Table
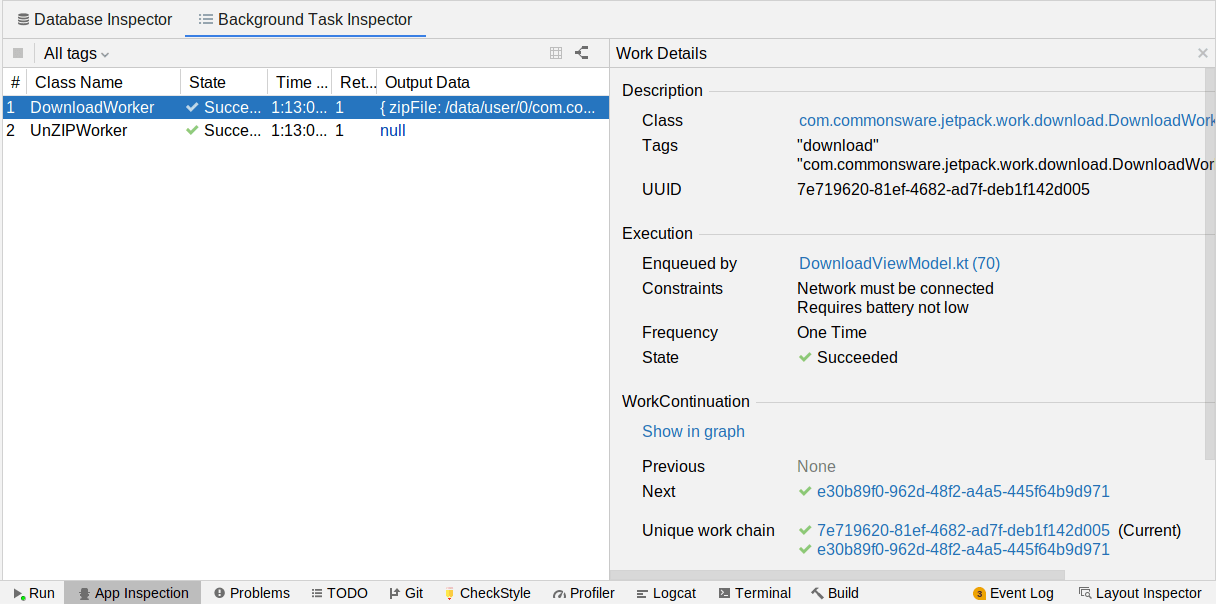
The default view is a table showing the work. Initially, that table will be empty, but if you schedule some WorkManager work, the table will show that work:


You are given:
- The Java/Kotlin class that implements the
Workerinterface that is handling the work - What state that work is in (e.g., running, blocked, succeeded, failed)
- When the work entered the running state
- Whether the work was retried due to some problem (
1means it was never retried) - A quasi-JSON depiction of what output data was supplied by the work (or
nullif the work had no output data)
In these screenshots, we have the work from the UnZIPWork sample app. The first screenshot shows the in-progress download work, while the second screenshot shows the results of the completed chain of work.
The Work Details Panel
If you click on a row in the table, a side panel will open with details of the particular piece of work that you chose:

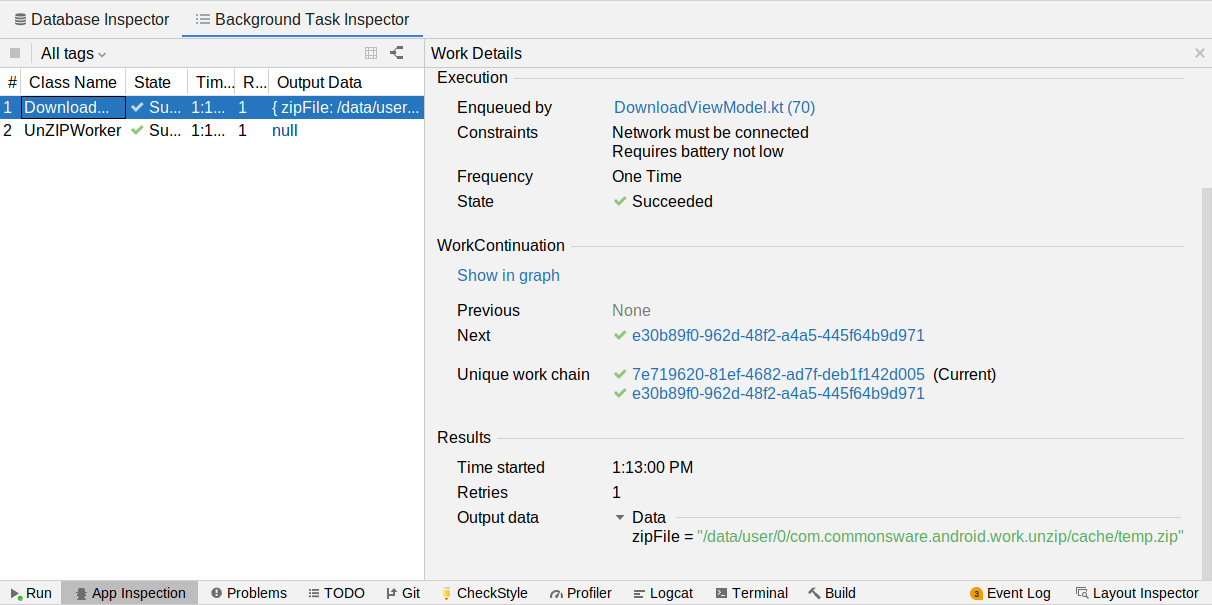
The panel is long and probably will require you to scroll to see everything:

Here you can find out everything that WorkManager knows about that piece of work, including:
- The generated UUID that uniquely identifies the work
- What code requested the work
- What the constraints were on when the work should be done
- Whether this was a one-time piece of work or an instance of a periodic work request
- The UUIDs of any preceding or follow-on pieces of work in a chain
The Flow Diagram
For simple chains of work, there is a good chance that the table is all that you will need to determine what happened with your requested bits of work. But if you have a complex work chain, with branching and merging and so forth, there is a flowchart-style icon in the top bar of the table that switches that view to a flowchart-style representation of the work chain:

The icon next to the flowchart one switches you back to the table view.
The Tag Filter
You might have a lot of work.
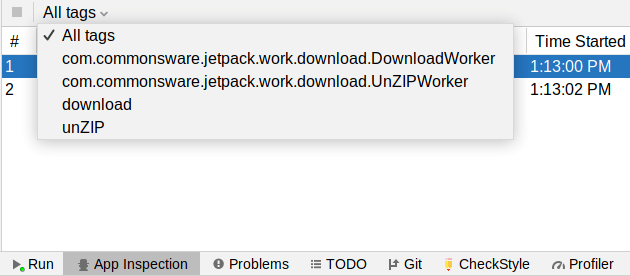
To help you sift through it, you can filter the table view. There is a drop-down in the table’s top bar that defaults to “All tags” — clicking it gives you options of filtering by Java/Kotlin class or by actual tags that you attached to your work:

Prev Table of Contents Next
This book is licensed under the Creative Commons Attribution-ShareAlike 4.0 International license.