Running Your App in the Debugger
The SimpleBoom module in the Sampler and SamplerJ projects is very similar to the SimpleButton example we looked at in the chapter on widgets. There are three main differences:
- The button now has a text caption defined in the layout via the
android:textattribute:
<?xml version="1.0" encoding="utf-8"?>
<Button android:id="@+id/showElapsed"
  xmlns:android="http://schemas.android.com/apk/res/android"
  android:layout_width="wrap_content"
  android:layout_height="wrap_content"
  android:text="@string/elapsed_caption"
  android:textSize="@dimen/hello_size" />
- We no longer immediately update the button when starting the activity, so that caption shows up:
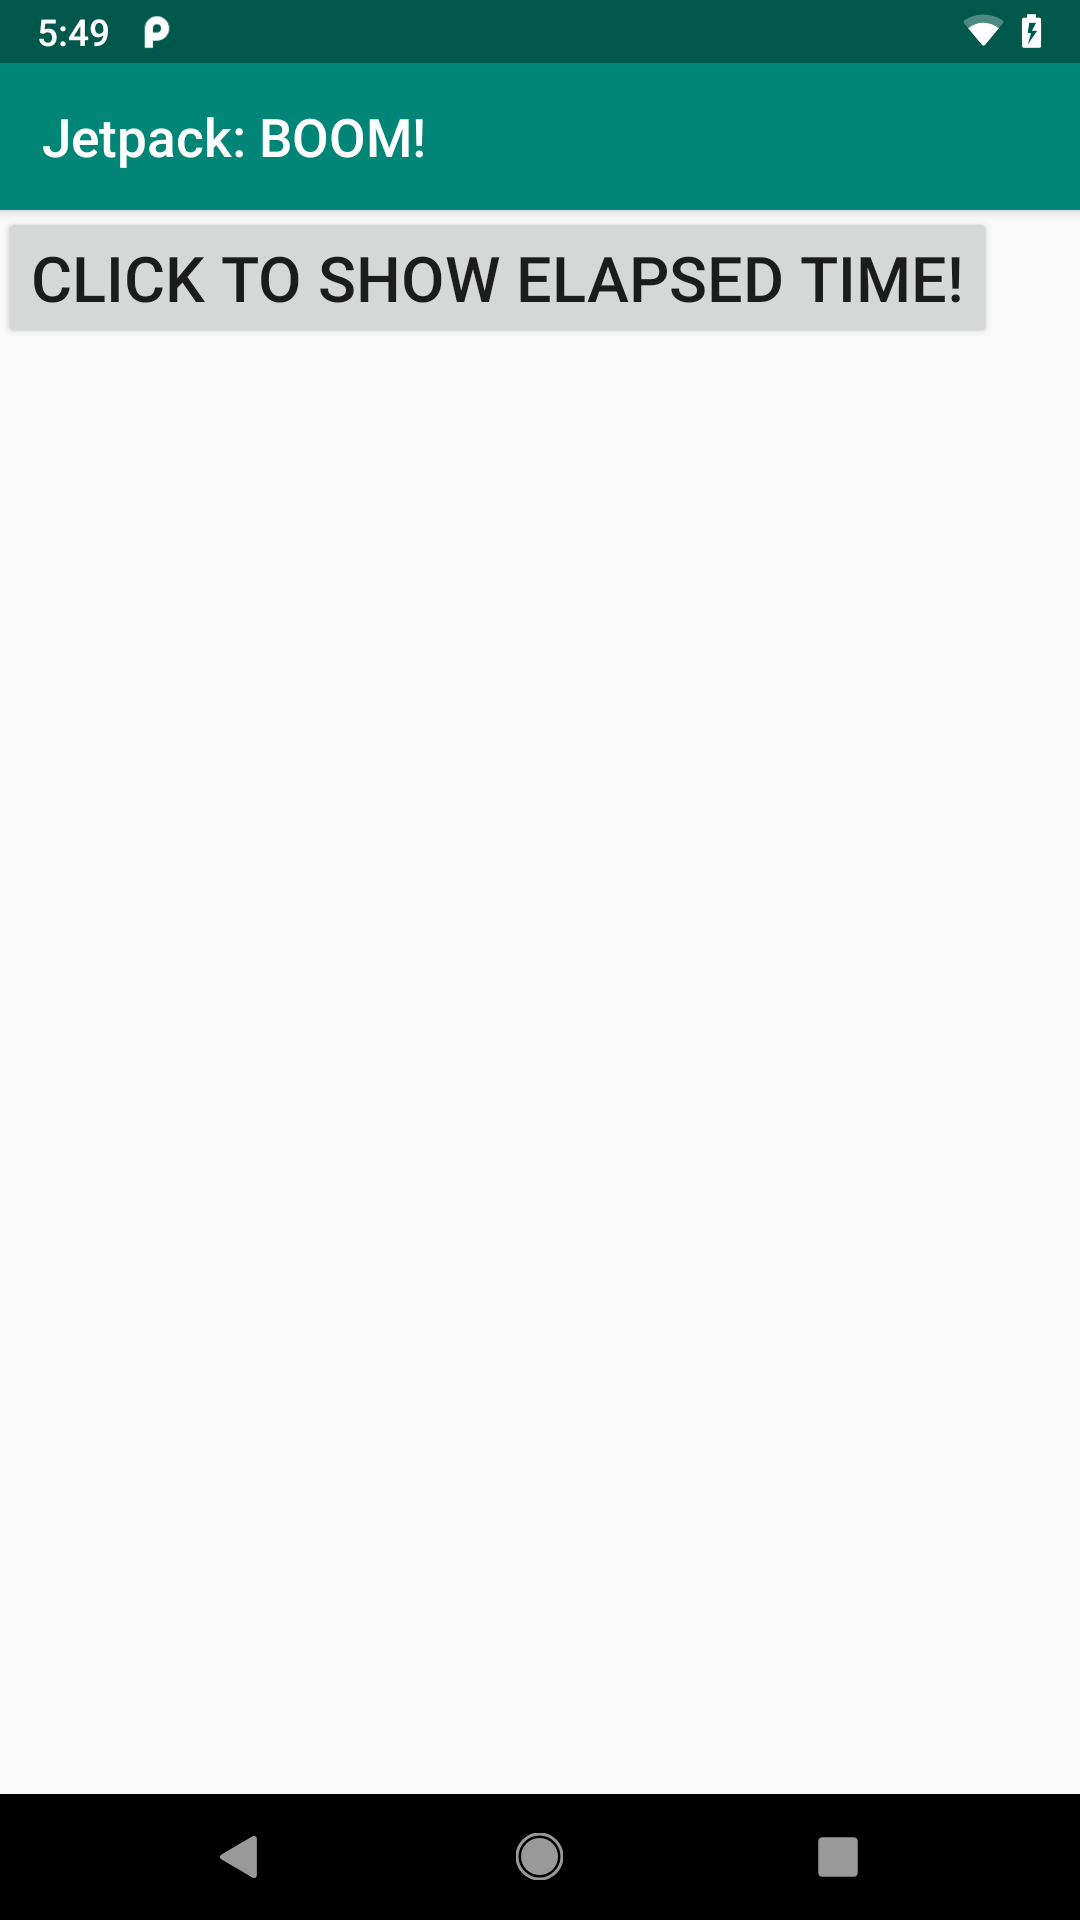
- We crash when the user taps the button
Sometimes, the stack trace alone will give you enough information to know how to fix the bug. If not, you can run your app in the debugger to see exactly how your code is executing and perhaps get a better sense for your mistake.
Setting Breakpoints
In our Java and Kotlin code editors in Android Studio, the vertical bar on the left is called “the gutter”:
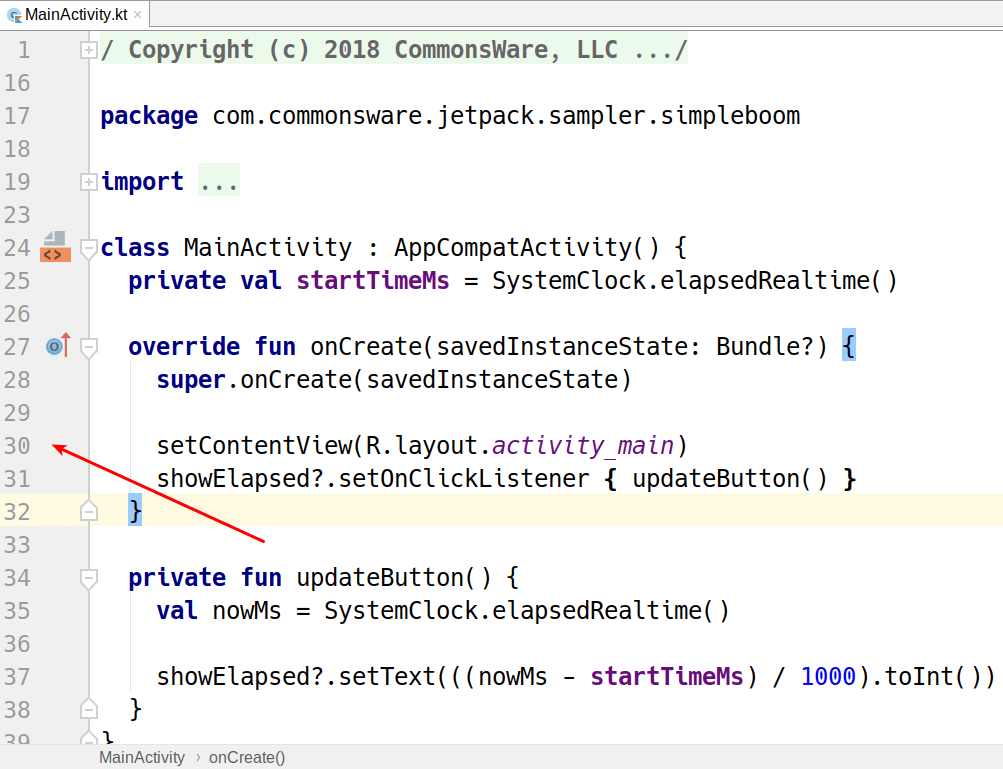
The author of this book likes having the line numbers visible. To control whether those show up, go to Files > Settings > Editor > General > Apperance — the “Show line numbers” checkbox controls whether the gutter shows line numbers.
Clicking in the gutter on a line of source code will set a breakpoint, which appears as a red dot in the gutter and a pink highlight on the line:
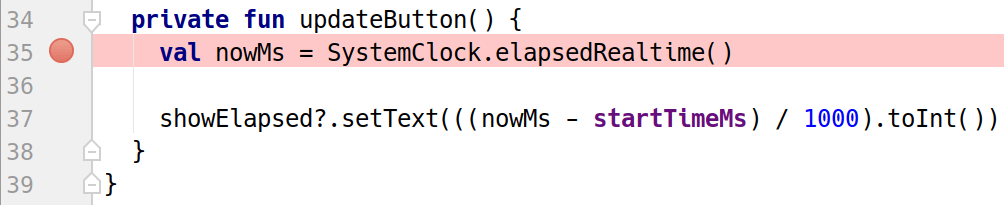
When you run your app using the debugger, when code execution reaches lines with a breakpoint, execution stops and you can use the IDE to learn more about what is going on.
For lines containing lambda expressions, when you click in the gutter to set a breakpoint, you will get a drop-down menu of options for what the breakpoint should affect:
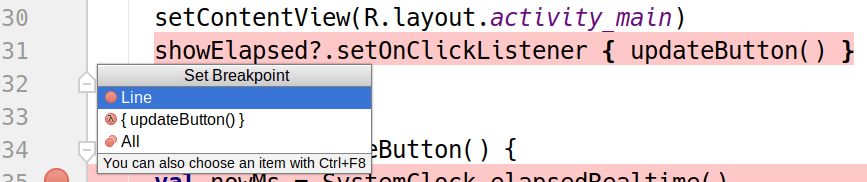
Your options are:
- Set the breakpoint for the initial code on the line (“Line”)
- Set the breakpoint to trigger when the lambda expression is executed (“
{ updateButton() }”) - Both (“All”)
Launching the Debugger
To run the app and have the breakpoints take effect, you need to run it in the debugger. You can do this from the Run > Debug main menu option or the “green bug” toolbar icon:

This behaves a lot like when you normally run the app. However, the app will run more slowly, and when the breakpoint is reached, your IDE window will open a Debug tool that shows you what is going on:
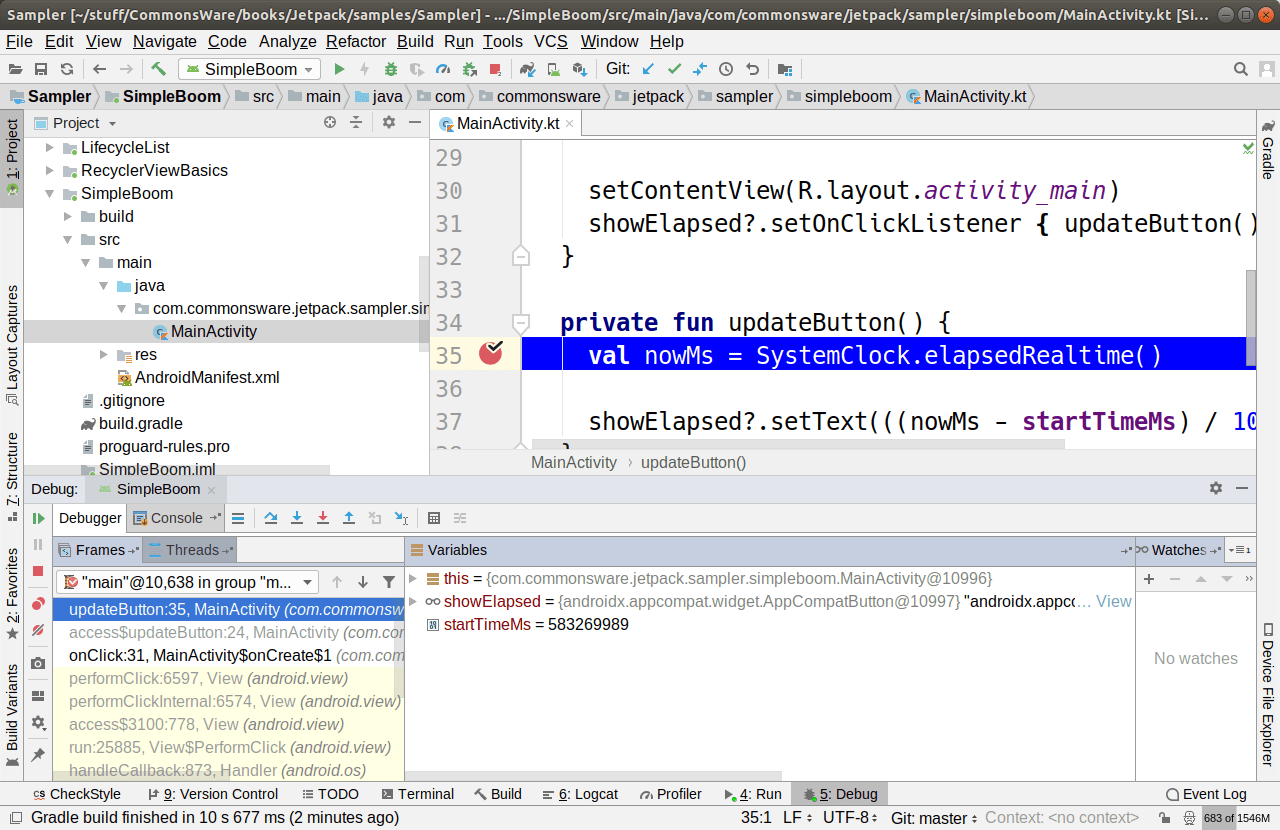
Examining Objects
The middle of the Debug tool shows a “Variables” list. This will contain local variables, fields/properties of the current object, and other values that your code might be referencing:
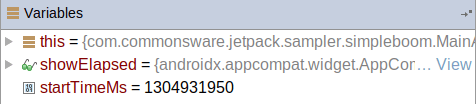
Simple types, like the Long value nowMs, just show their value. More complex types will show you their type and can be explored in turn using the gray triangle to expand the object tree:
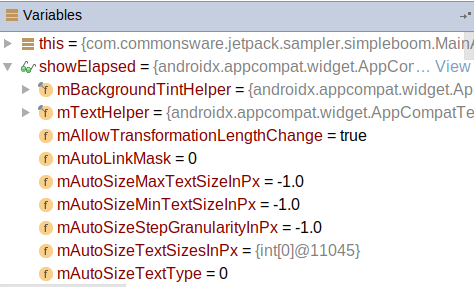
This can help you understand the data at this point in the code.
Stepping Through the Code
The toolbar towards the top of the Debug tool has a few buttons that let you step through the code to follow along as it gets executed:

From left to right, these are:
- Execute this statement and move into the next one
- Step into the function being called in this statement, if it is not an Android SDK function
- Step into the function being called in this statement, even if it is an Android SDK function
- Execute far enough to exit the function that we are in and then stop
Also, there is a tool strip on the left with a few useful buttons:

Of particular note:
- The top-most button (green triangle) will start executing code until the next breakpoint or crash
- The red square terminates your process
- The fourth button (two overlapping red dots) brings up a dialog box showing you all of your breakpoints
Prev Table of Contents Next
This book is licensed under the Creative Commons Attribution-ShareAlike 4.0 International license.