Debugging Your App
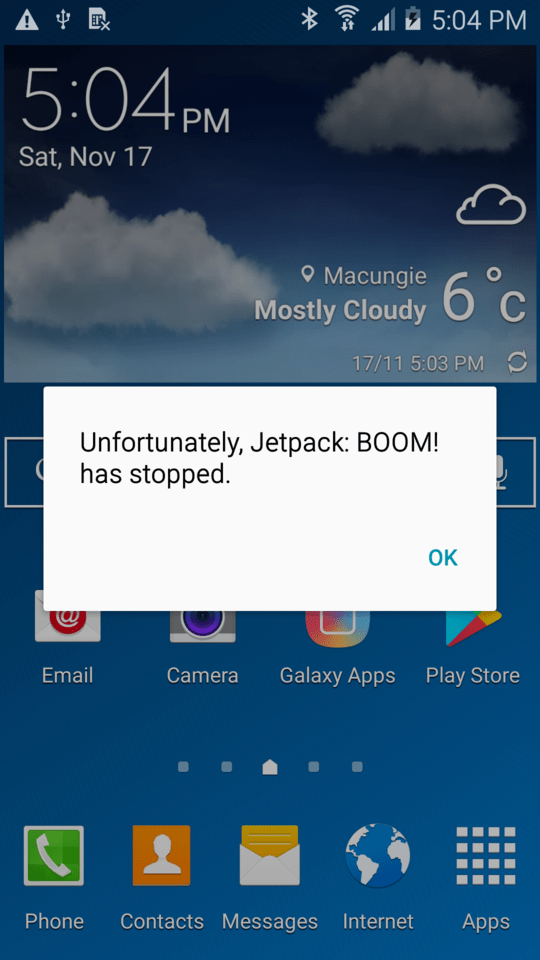
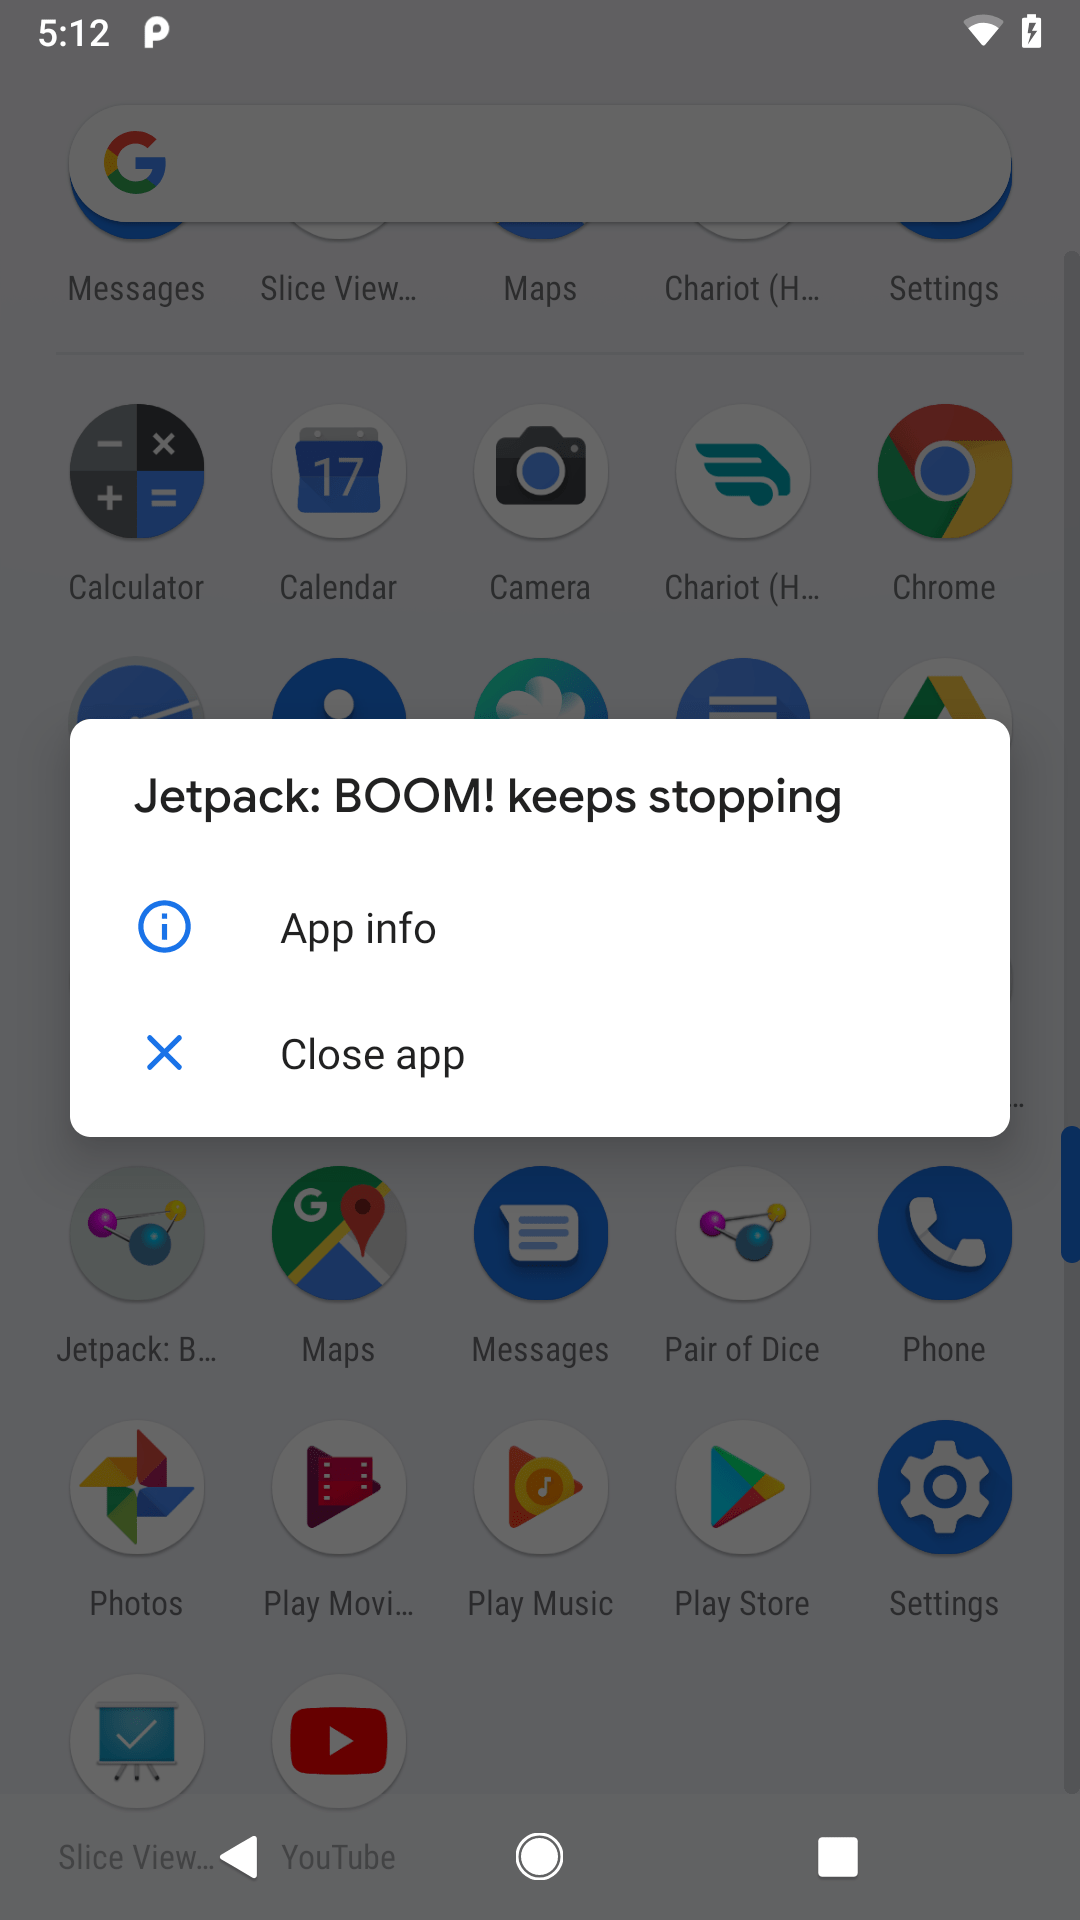
Now that we are starting to manipulate widgets, the odds increase that we are going to somehow do it wrong, and our app will crash. Usually, when your app crashes, the OS will show a dialog box:


In this chapter, we will cover a few tips on how to debug these sorts of issues.
Get Thee To a Stack Trace
If it seems like your app has crashed, the first thing you will want to do is examine the stack trace that is associated with this crash. These are logged to a facility known as Logcat, on your device or emulator. You can view those logs using the Logcat tool in Android Studio.
The Logcat tool is available at any time, from pretty much anywhere in Android Studio, by means of clicking on the Android tool window entry, usually docked at the bottom of your IDE window:

Clicking on that will bring up some Android-specific logs in an Logcat tool window:

Logcat will show your stack traces, diagnostic information from the operating system, and anything you wish to include via calls to static methods on the android.util.Log class. For example, Log.e() will log a message at error severity, causing it to be displayed in red.
The toolbar across the top of the Logcat window has a drop-down list of available devices and running emulators. Whichever one is selected there is the source of the log messages seen in the main area of the Logcat tool window.
If your app crashes, most of the time, there will be an associated Java stack trace (even if you are writing Kotlin code). For example the stack trace that triggered the crash dialog shown at the start of this chapter is:
E/AndroidRuntime: FATAL EXCEPTION: main
    Process: com.commonsware.jetpack.sampler.simpleboom, PID: 14064
    java.lang.RuntimeException: Unable to start activity...
        at android.app.ActivityThread.performLaunchActivity(ActivityThread.java:2693)
        at android.app.ActivityThread.handleLaunchActivity(ActivityThread.java:2758)
        at android.app.ActivityThread.access$900(ActivityThread.java:177)
        at android.app.ActivityThread$H.handleMessage(ActivityThread.java:1448)
        at android.os.Handler.dispatchMessage(Handler.java:102)
        at android.os.Looper.loop(Looper.java:145)
        at android.app.ActivityThread.main(ActivityThread.java:5942)
        at java.lang.reflect.Method.invoke(Native Method)
        at java.lang.reflect.Method.invoke(Method.java:372)
        at com.android.internal.os.ZygoteInit$MethodAndArgsCaller.run...
        at com.android.internal.os.ZygoteInit.main(ZygoteInit.java:1195)
     Caused by: android.content.res.Resources$NotFoundException: String resource...
        at android.content.res.Resources.getText(Resources.java:1334)
        at android.widget.TextView.setText(TextView.java:4917)
        at com.commonsware.jetpack.sampler.simpleboom.MainActivity...
        at com.commonsware.jetpack.sampler.simpleboom.MainActivity...
        at android.app.Activity.performCreate(Activity.java:6283)
        at android.app.Instrumentation.callActivityOnCreate(Instrumentation.java:1119)
        at android.app.ActivityThread.performLaunchActivity(ActivityThread.java:2646)
        at android.app.ActivityThread.handleLaunchActivity(ActivityThread.java:2758)
        at android.app.ActivityThread.access$900(ActivityThread.java:177)
        at android.app.ActivityThread$H.handleMessage(ActivityThread.java:1448)
        at android.os.Handler.dispatchMessage(Handler.java:102)
        at android.os.Looper.loop(Looper.java:145)
        at android.app.ActivityThread.main(ActivityThread.java:5942)
        at java.lang.reflect.Method.invoke(Native Method)
        at java.lang.reflect.Method.invoke(Method.java:372)
        at com.android.internal.os.ZygoteInit$MethodAndArgsCaller.run...
        at com.android.internal.os.ZygoteInit.main(ZygoteInit.java:1195)
(note: some lines were truncated with ... to try to make the output fit the page width better)
Most of the time — though not always — you should be able to find references to your code in the stack trace, to know where you were when you crashed.
If you want to send something from Logcat to somebody else, such as via an issue tracker, just highlight the text and copy it to the clipboard, as you would with any text editor.
The “trash can” icon atop the tool strip on the left is the “clear log” tool. Clicking it will appear to clear Logcat. It definitely clears your Logcat view, so you will only see messages logged after you cleared it. Note, though, that this does not actually clear the logs from the device or emulator.
In addition, you can:
- Use the “Log level” drop-down to filter lines based on severity, where messages for your chosen severity or higher will be displayed (e.g., only show “Error” severity)
- Use the search field to the right of the “Log level” drop-down to filter items based on a search string
- Set up more permanent filters via the drop-down to the right of the search field (e.g., “No Filters”)
Prev Table of Contents Next
This book is licensed under the Creative Commons Attribution-ShareAlike 4.0 International license.